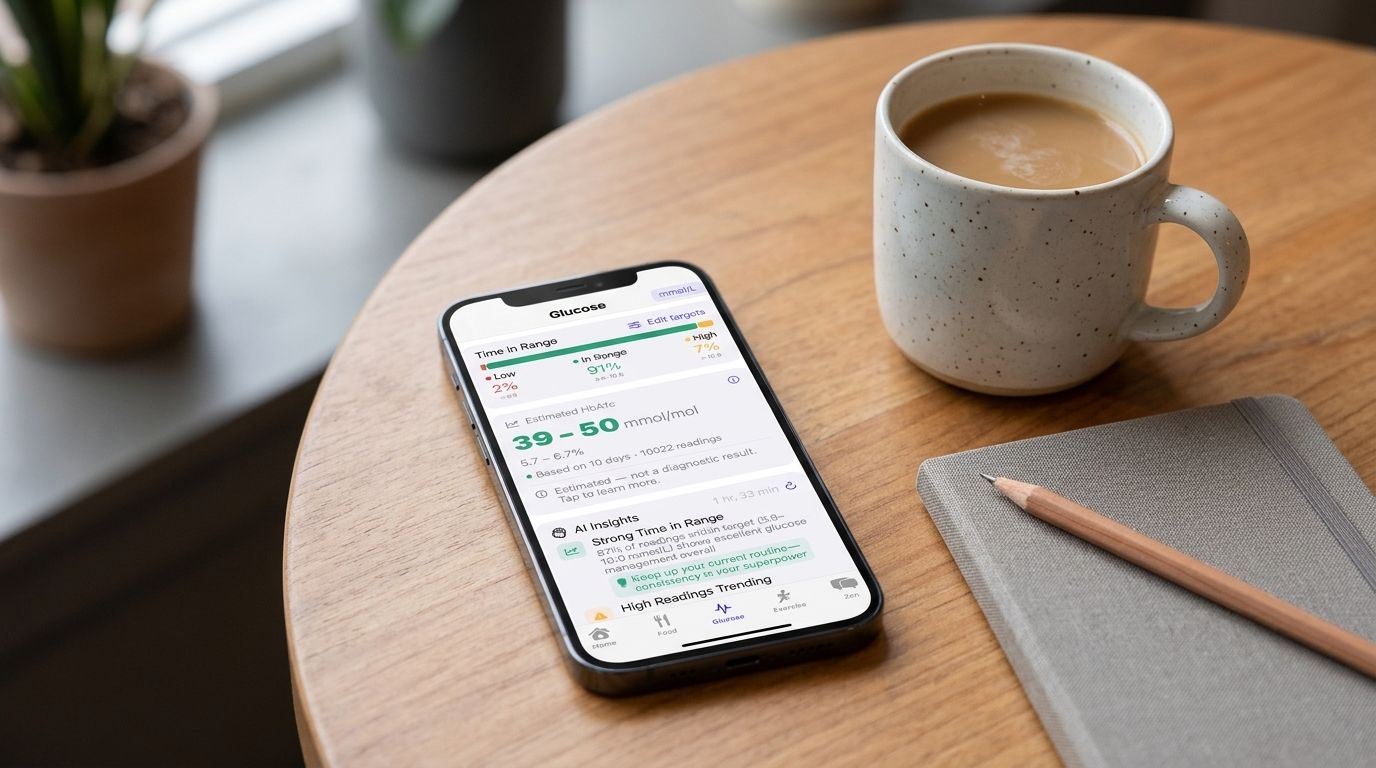
You get a number back from a blood test: "your HbA1c is 6.9%." It's a different kind of number from the one on your glucose meter or your CGM graph, and it's easy to come away unsure what it actually means, or how worried to be about it. Here's what HbA1c is actually measuring, what the ranges mean, and why it tells you something a daily reading can't.
What HbA1c actually measures
When glucose is in your bloodstream, some of it attaches to haemoglobin, the protein in red blood cells that carries oxygen. Once it's attached, it stays attached for the life of that red blood cell, roughly two to three months. HbA1c measures the percentage of your haemoglobin that has glucose stuck to it.
That's why it's often described as a "three-month average," though that's a simplification. In practice, the most recent four to eight weeks make up the largest share of the result, since red blood cells are constantly being replaced on a rolling basis. It's less a clean average and more a weighted snapshot that leans heavily toward your recent weeks.
Why it's not the same as a daily reading
This is the part that trips people up most: two people can have the exact same HbA1c and have completely different day-to-day patterns. One person might run steady glucose all day, every day. Another might swing high after meals and low overnight, averaging out to an identical number. HbA1c can't tell the difference between the two, because it only reflects the average, not the shape of the ups and downs.
That's exactly why HbA1c and daily glucose monitoring are meant to work together, not replace each other. HbA1c tells you the overall trend. A glucose trend graph tells you what's actually happening meal to meal, which is often where the useful, actionable detail lives.
What the ranges mean
The American Diabetes Association and the UK's NICE guidelines agree that an HbA1c of 6.5% (48 mmol/mol) or above indicates diabetes. Below that, though, the picture gets slightly less uniform:
- Normal: below 5.7% (39 mmol/mol) under ADA guidance.
- Prediabetes: ADA sets this at 5.7-6.4% (39-47 mmol/mol). NICE in the UK sets a slightly higher floor, 6.0-6.4% (42-47 mmol/mol).
- Diabetes: 6.5% (48 mmol/mol) or above, under both.
That gap matters in practice. A result of 40 mmol/mol would be flagged as prediabetic under ADA guidance but sit in the normal range under NICE's. If you've seen two slightly different explanations of "what counts as prediabetic," this is usually why, and it's worth asking your own care team which guideline they're working from rather than comparing your number against a chart from a different country.
Your own target range may also be different from any of these. People managing diabetes with other health conditions, or who are pregnant, or who are older, are often given a different personal target by their care team. These ranges are a general reference point, not a one-size-fits-all target.
What else can move the number
Day-to-day glucose patterns are the biggest driver, but a few other things can genuinely affect an HbA1c result. Certain blood conditions, including some forms of anaemia and haemoglobin variants, can throw the reading off in either direction. Recent significant blood loss or a blood transfusion can also temporarily distort it. None of this is something to self-diagnose from a search result, but it's one more reason an HbA1c result is best interpreted with your care team rather than read in isolation.
How GlyBeat estimates HbA1c between tests
Most people only get an official HbA1c reading every few months at a check-up, which leaves a long gap where you have no real sense of where your average is heading. GlyBeat's estimate is built to fill that gap, not replace the lab test.
It works from your logged data: your HealthKit glucose readings carry the most weight, alongside the glycemic load of your food log, your exercise log (which tends to lower the estimate), your medication adherence, and photo-based food analysis where available. That combination runs through a published formula (the Nathan et al. relationship between average glucose and HbA1c) to produce an estimate.
A few things are deliberate about how it's presented. It's always shown as a range, such as "6.8-7.2%," never a single precise figure, because an estimate from everyday data isn't that exact. It also comes with a confidence note, like "based on 14 days of data" versus "based on 84 days of data," so you know how much it's leaning on. Every estimate is labelled clearly: "Estimated HbA1c, based on your logged data. Not a diagnostic result," and GlyBeat always prompts you to share it with your GP or specialist at your next appointment rather than treating it as a standalone result.
Zen, GlyBeat's AI companion, can also put the trend in context when it shifts: noticing, for instance, that your estimate has moved up over a week alongside a change in your logged meals, so the number comes with a reason attached rather than sitting there unexplained.